Power BI
Power BI
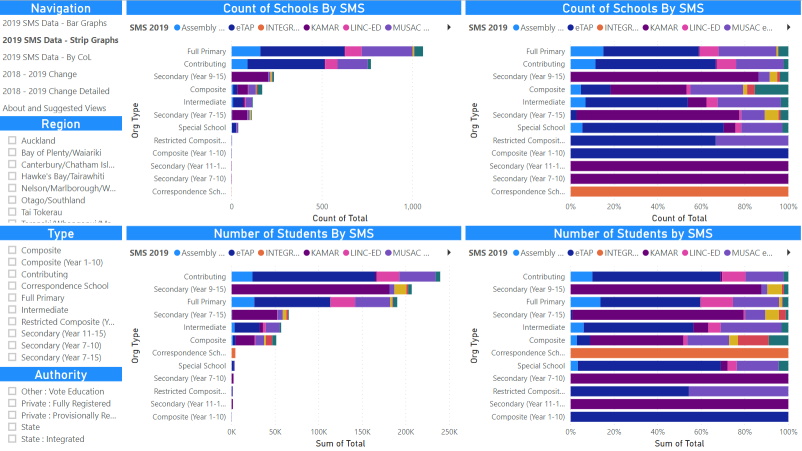
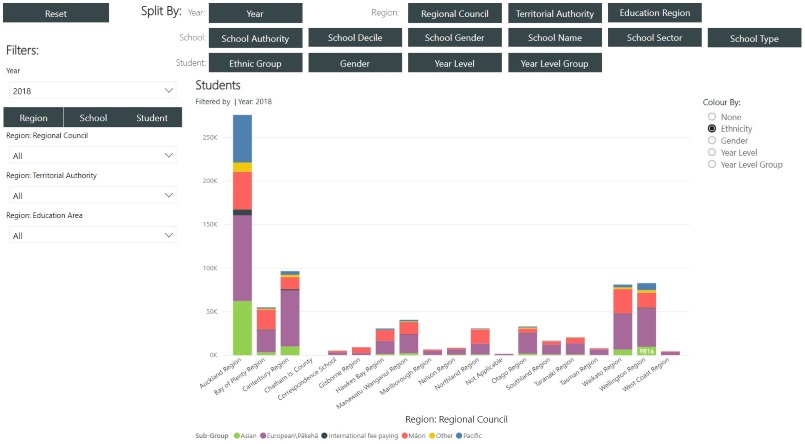
I love making stuff in PowerBI, including custom visuals. See here for a few examples of things I have built.
I've also made a video showing how to do a few cool things in Power BI... see dashboard created in the video here.
If you want me to build something for you, get in touch.
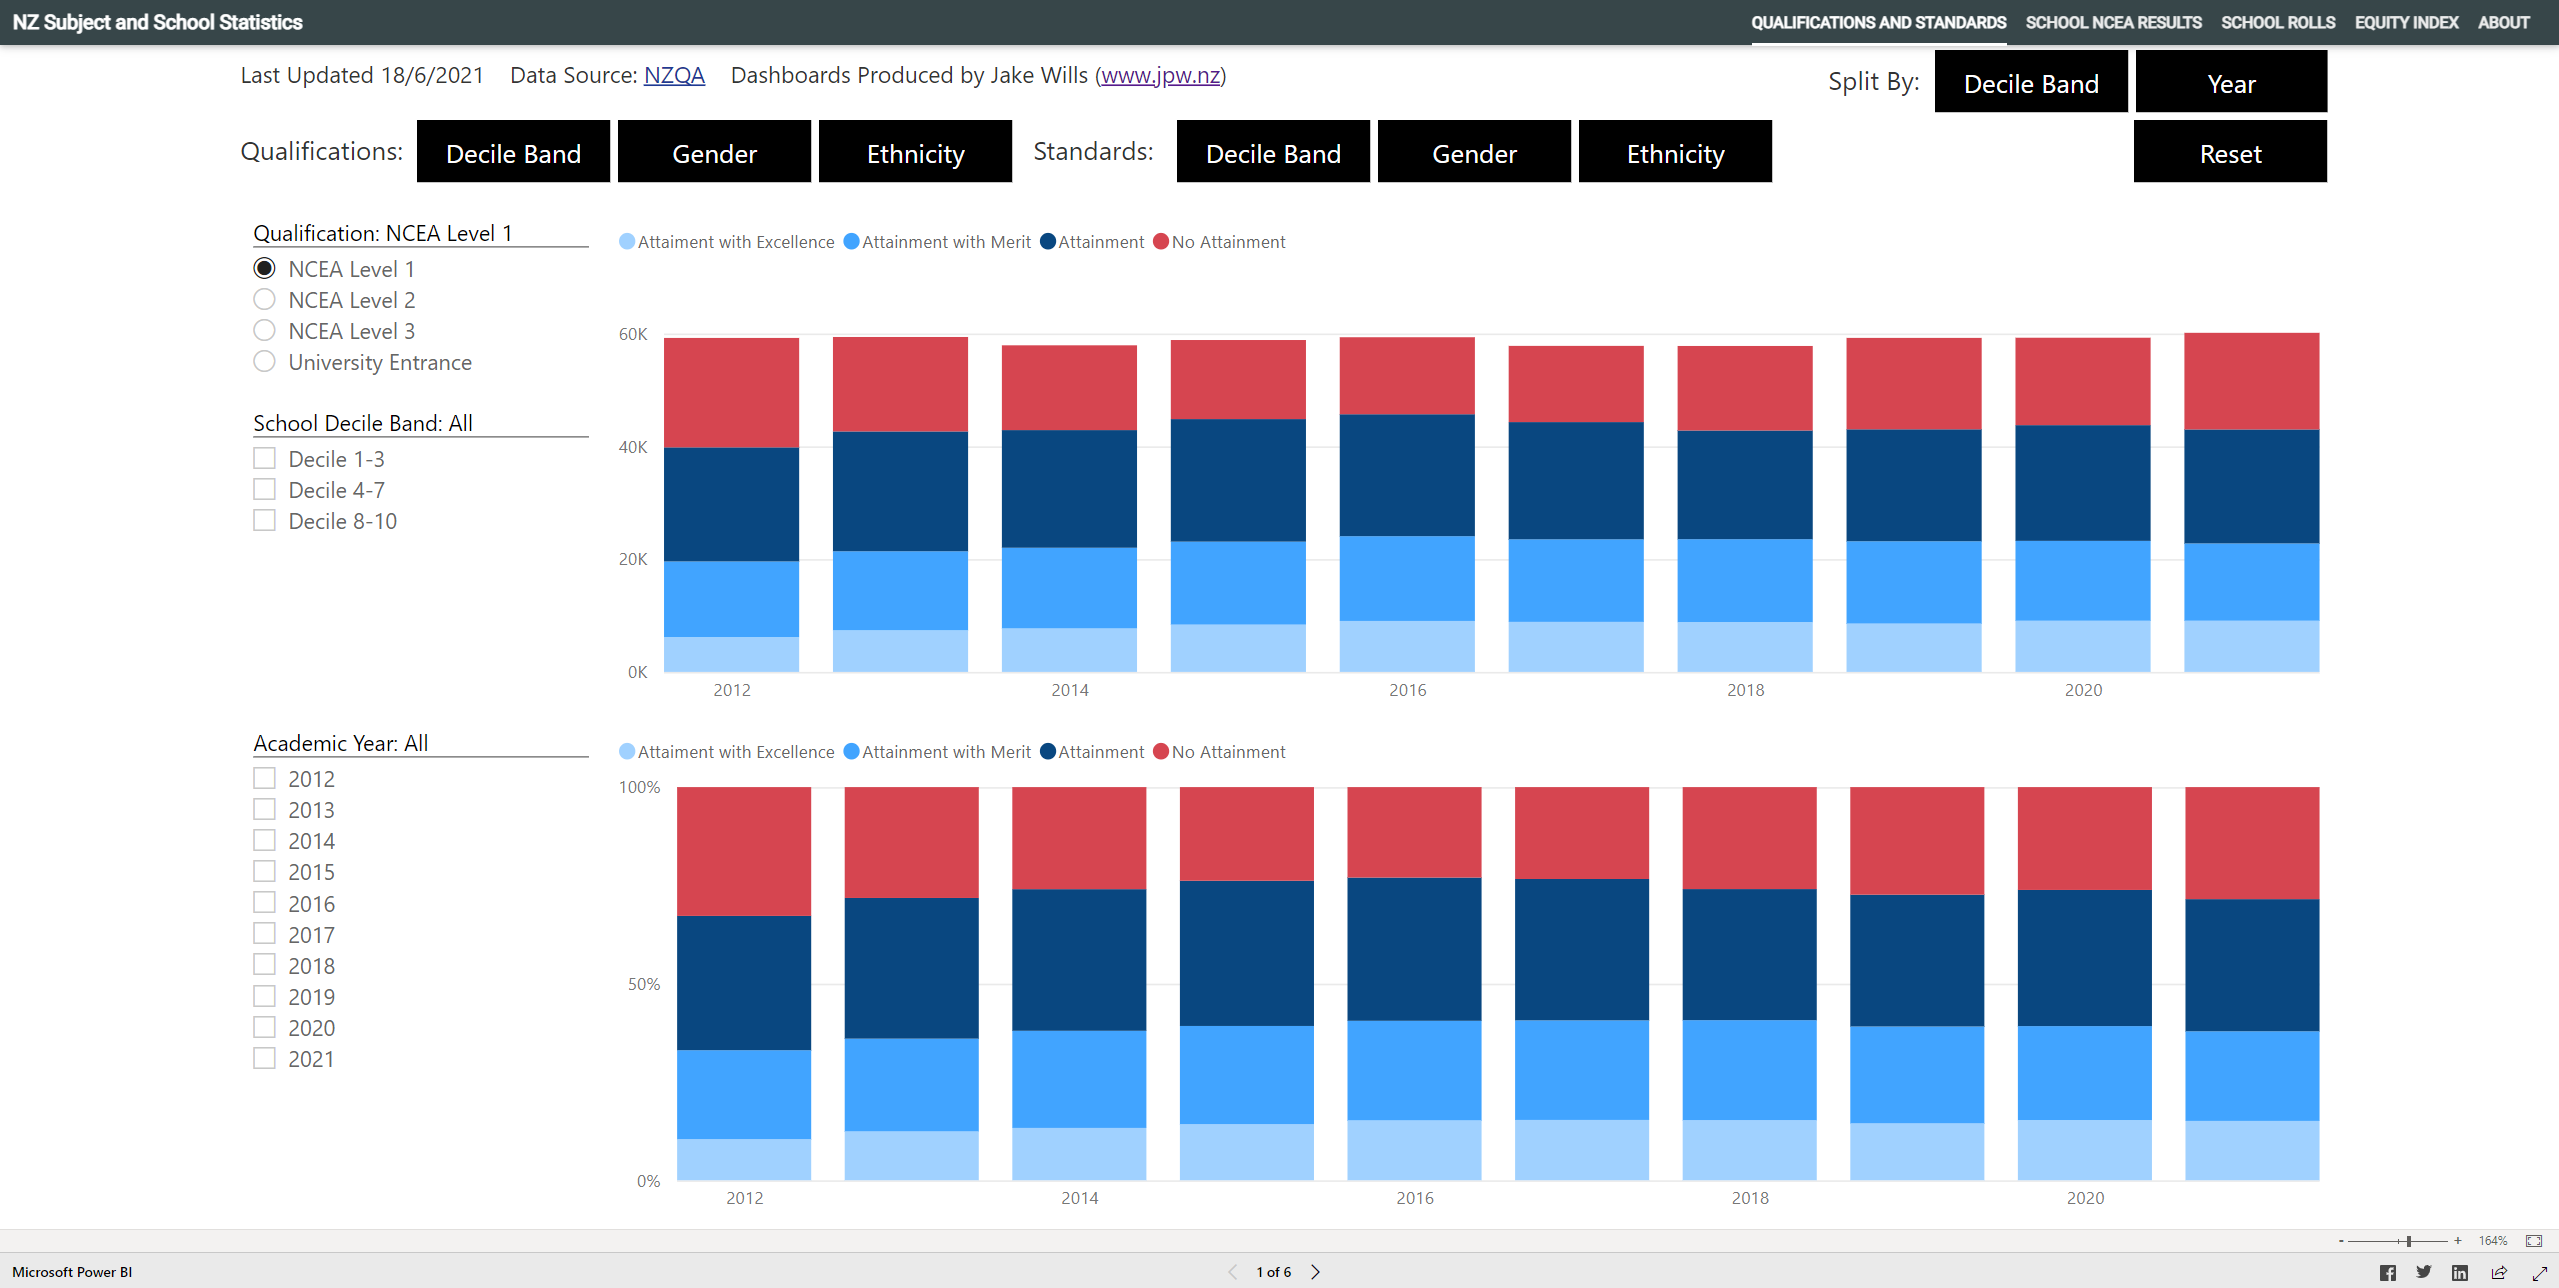
School Statistics - Using Public Data from NZQA and Education Counts
Includes National NCEA Statistics, School NCEA Results, School Rolls and Equity Index Data.
School Leaver Attainment - Up to 2017 Data - Using Public Data From Education Counts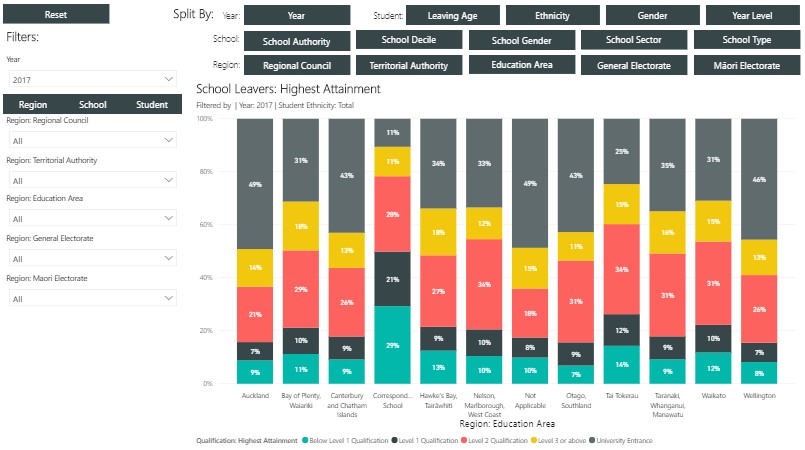
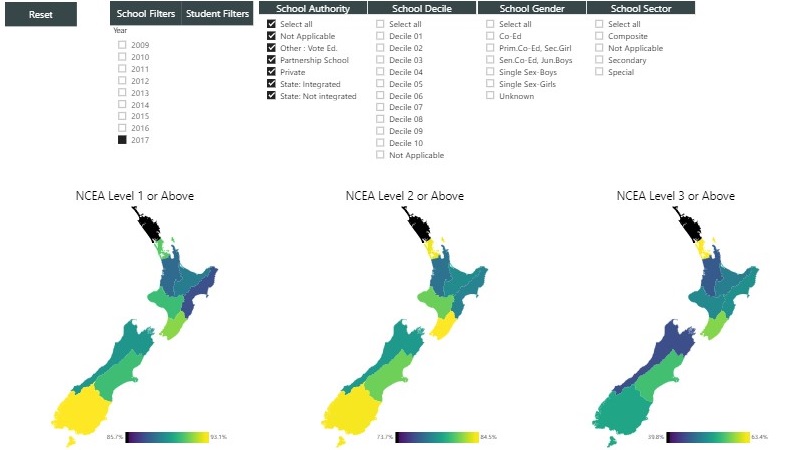


See second page for custom map visuals. Also published on Education Counts
Which SMS Schools are Using - As at July 2023 - Data from an OIA Request
